Introduction
The Summary Dashboard is the starting place to understand your usage of the system.Dashboard Filters
The data in the dashboard can be filtered when selecting the Change Search Filters dropdown. Here it is possible to filter submission statistics based on time, website, countries (locations completed from), IP addresses, fraud scores, submission statuses and the Submission Type. When filters are changed, they can be applied to the dashboard below by pressing the “Apply Filters” button. The search filters can be reset to default values by pressing the “Reset” button though this will not recalculate the data.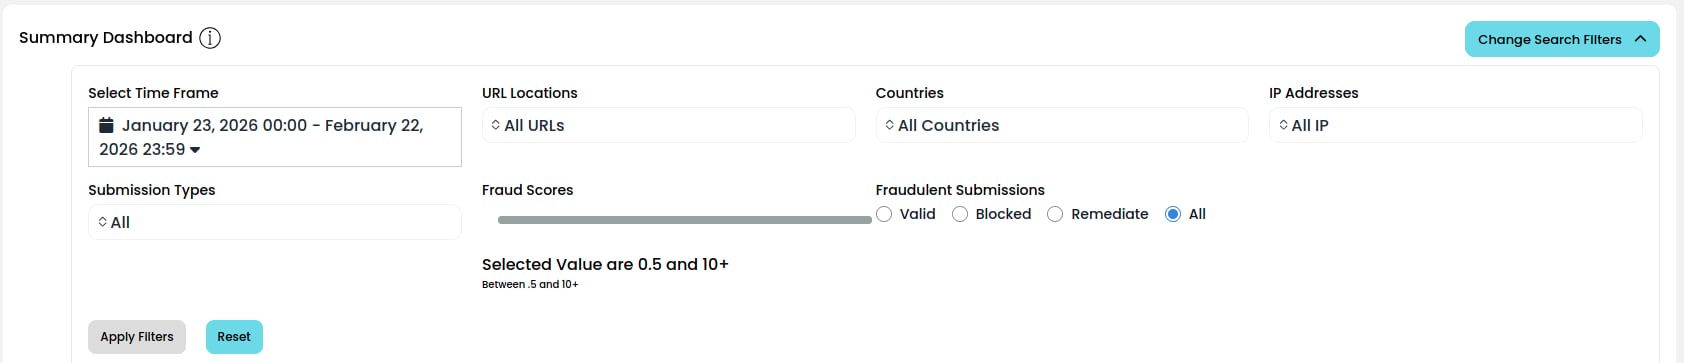
User Statistics
The top row shows the following statistics:- Total Submissions :: The number of times Quick Check tests were submitted with your email address. This includes blocked Quick Check attempts and successful submissions.
- Successful Submissions :: The number of tests which were completed successfully.
- Blocked Submissions :: The number of tests which were rejected.
- Remediated Fraud :: The number of fraudulent submissions which have been remediated.
- Solver Identified Fraud :: The number of submissions you have identified as being fraudulent.

Charts
The charts include:- Submission Percentages :: This is a pie chart showing the percentages of your submission statuses.
- Submissions Over Time :: This is a line chart showing the number of submissions you completed over time.
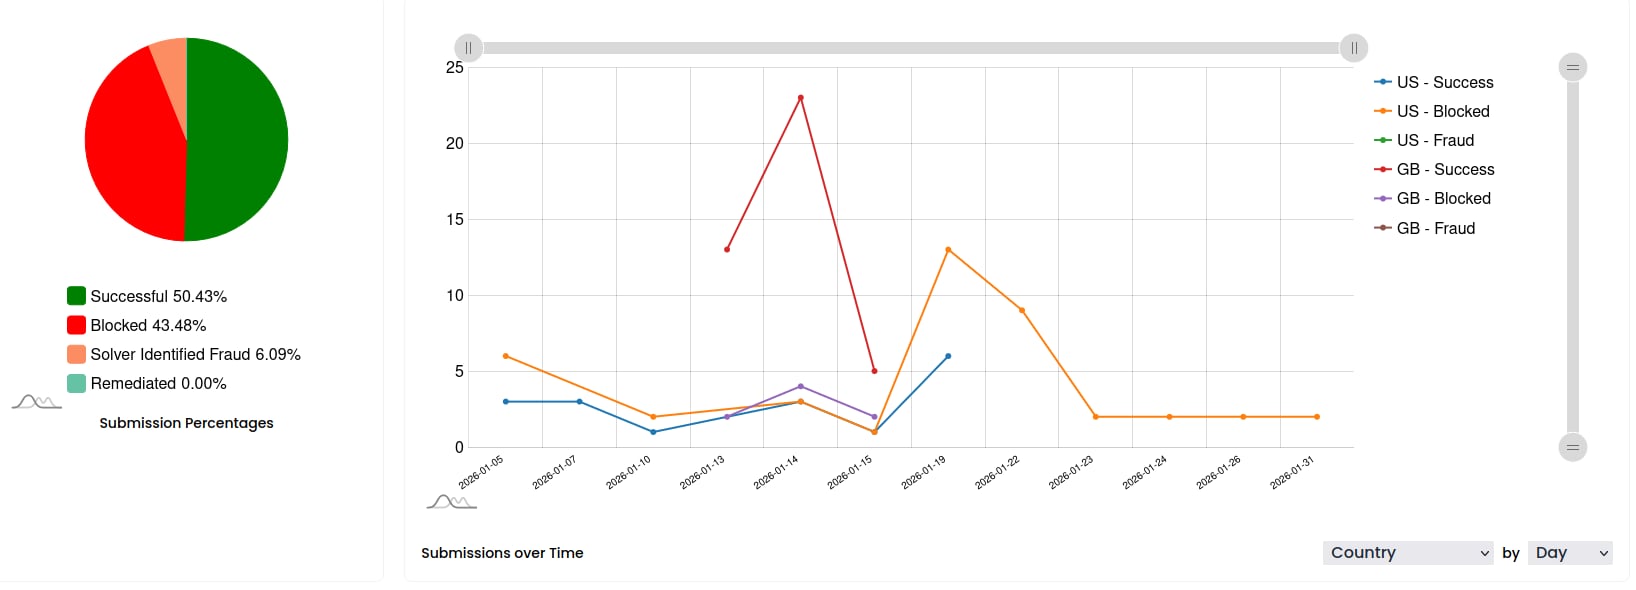
The line chart allows the legend items to be clicked on and off, the time can be grouped into either Days, Weeks or Months and the submissions can be grouped into Country, IP Address or Submission Type.
Tables
The tables include:- Submissions by Country :: The number of blocked and successful submissions by the country they were submitted from (location calculated by IP address).
- Submissions by Submission Type :: The number of submissions broken down by type of submission.
- Submissions by Website :: The number of submissions by each specific website they were submitted from.
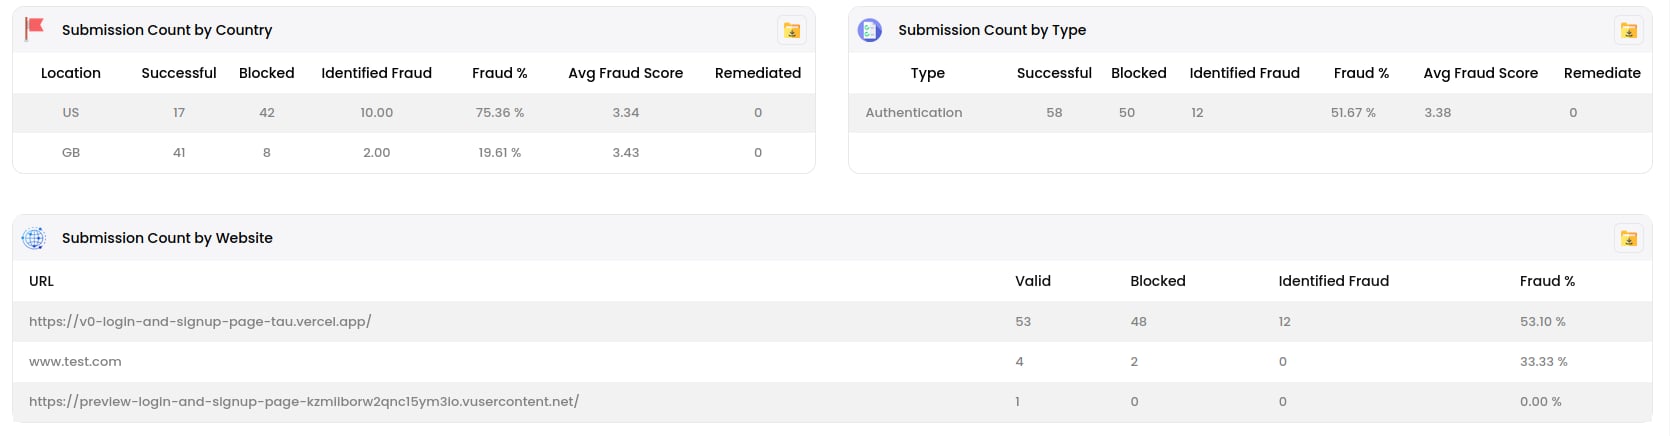
Every table is sortable by clicking its columns. If you have a premium subscription any table can be downloaded as a CSV file.
Map
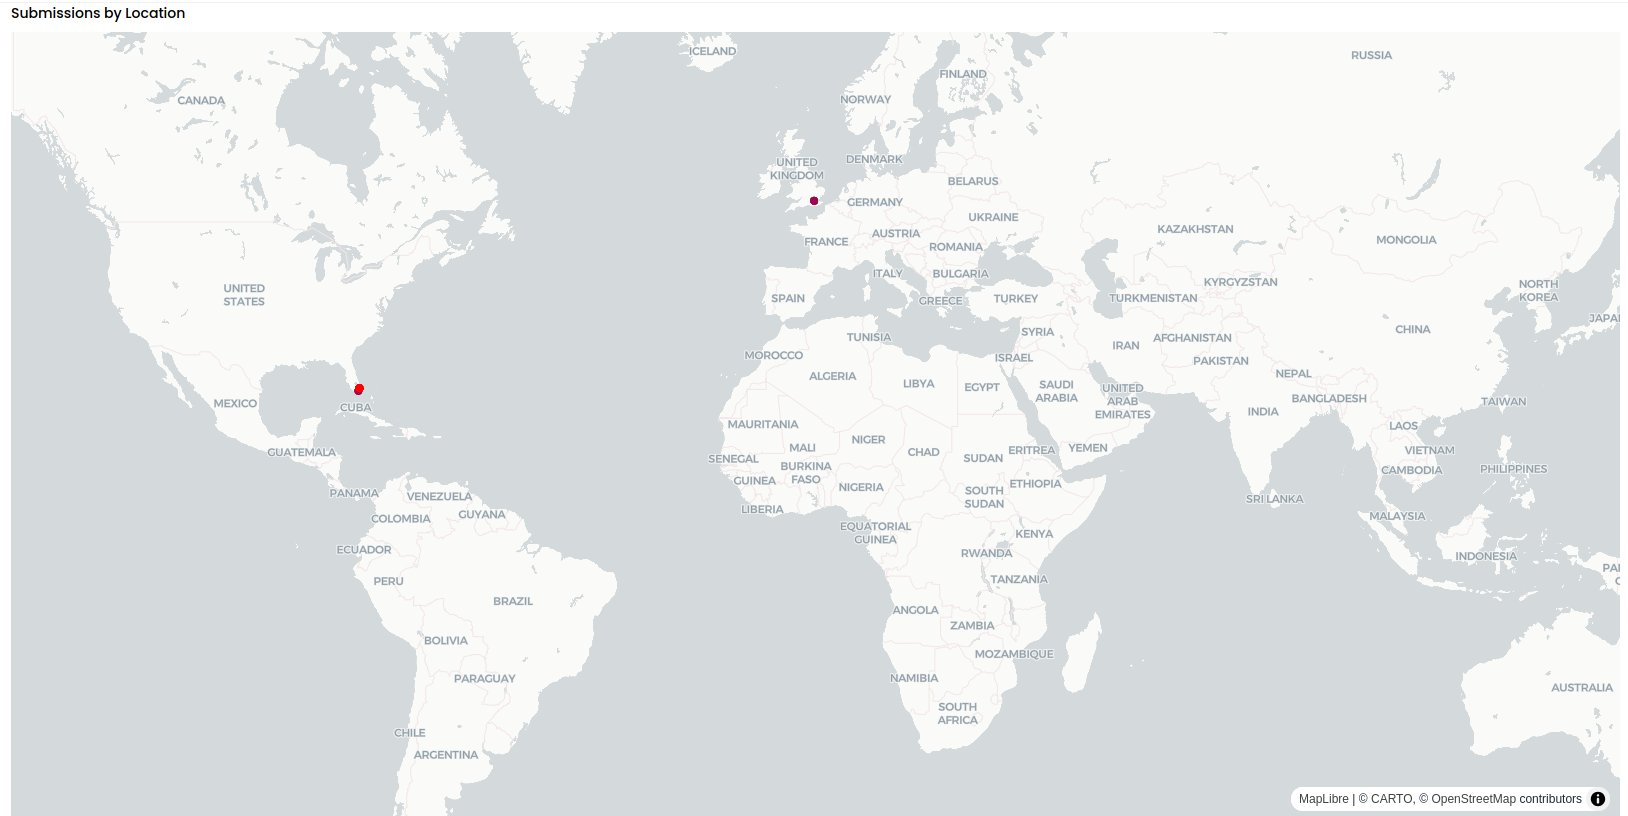
The map section shows the submissions by location calculated by the IP address used to submit each Quick Check test. Hovering over a dot can show more information about the submissions made from that location and clicking the dot will show those submissions in the Fraud Explorer dashboard.