
Introduction
This page gives a quick snapshot of how your usage of the Quick Check is affecting you from an ease-of-use, security and enjoyment standpoint. The top shows total or average values, while the charts below show activity over time. The top contains a few filters to look at different kinds of data.Search Filters
Search data by time, websites and submission types.
Statistics
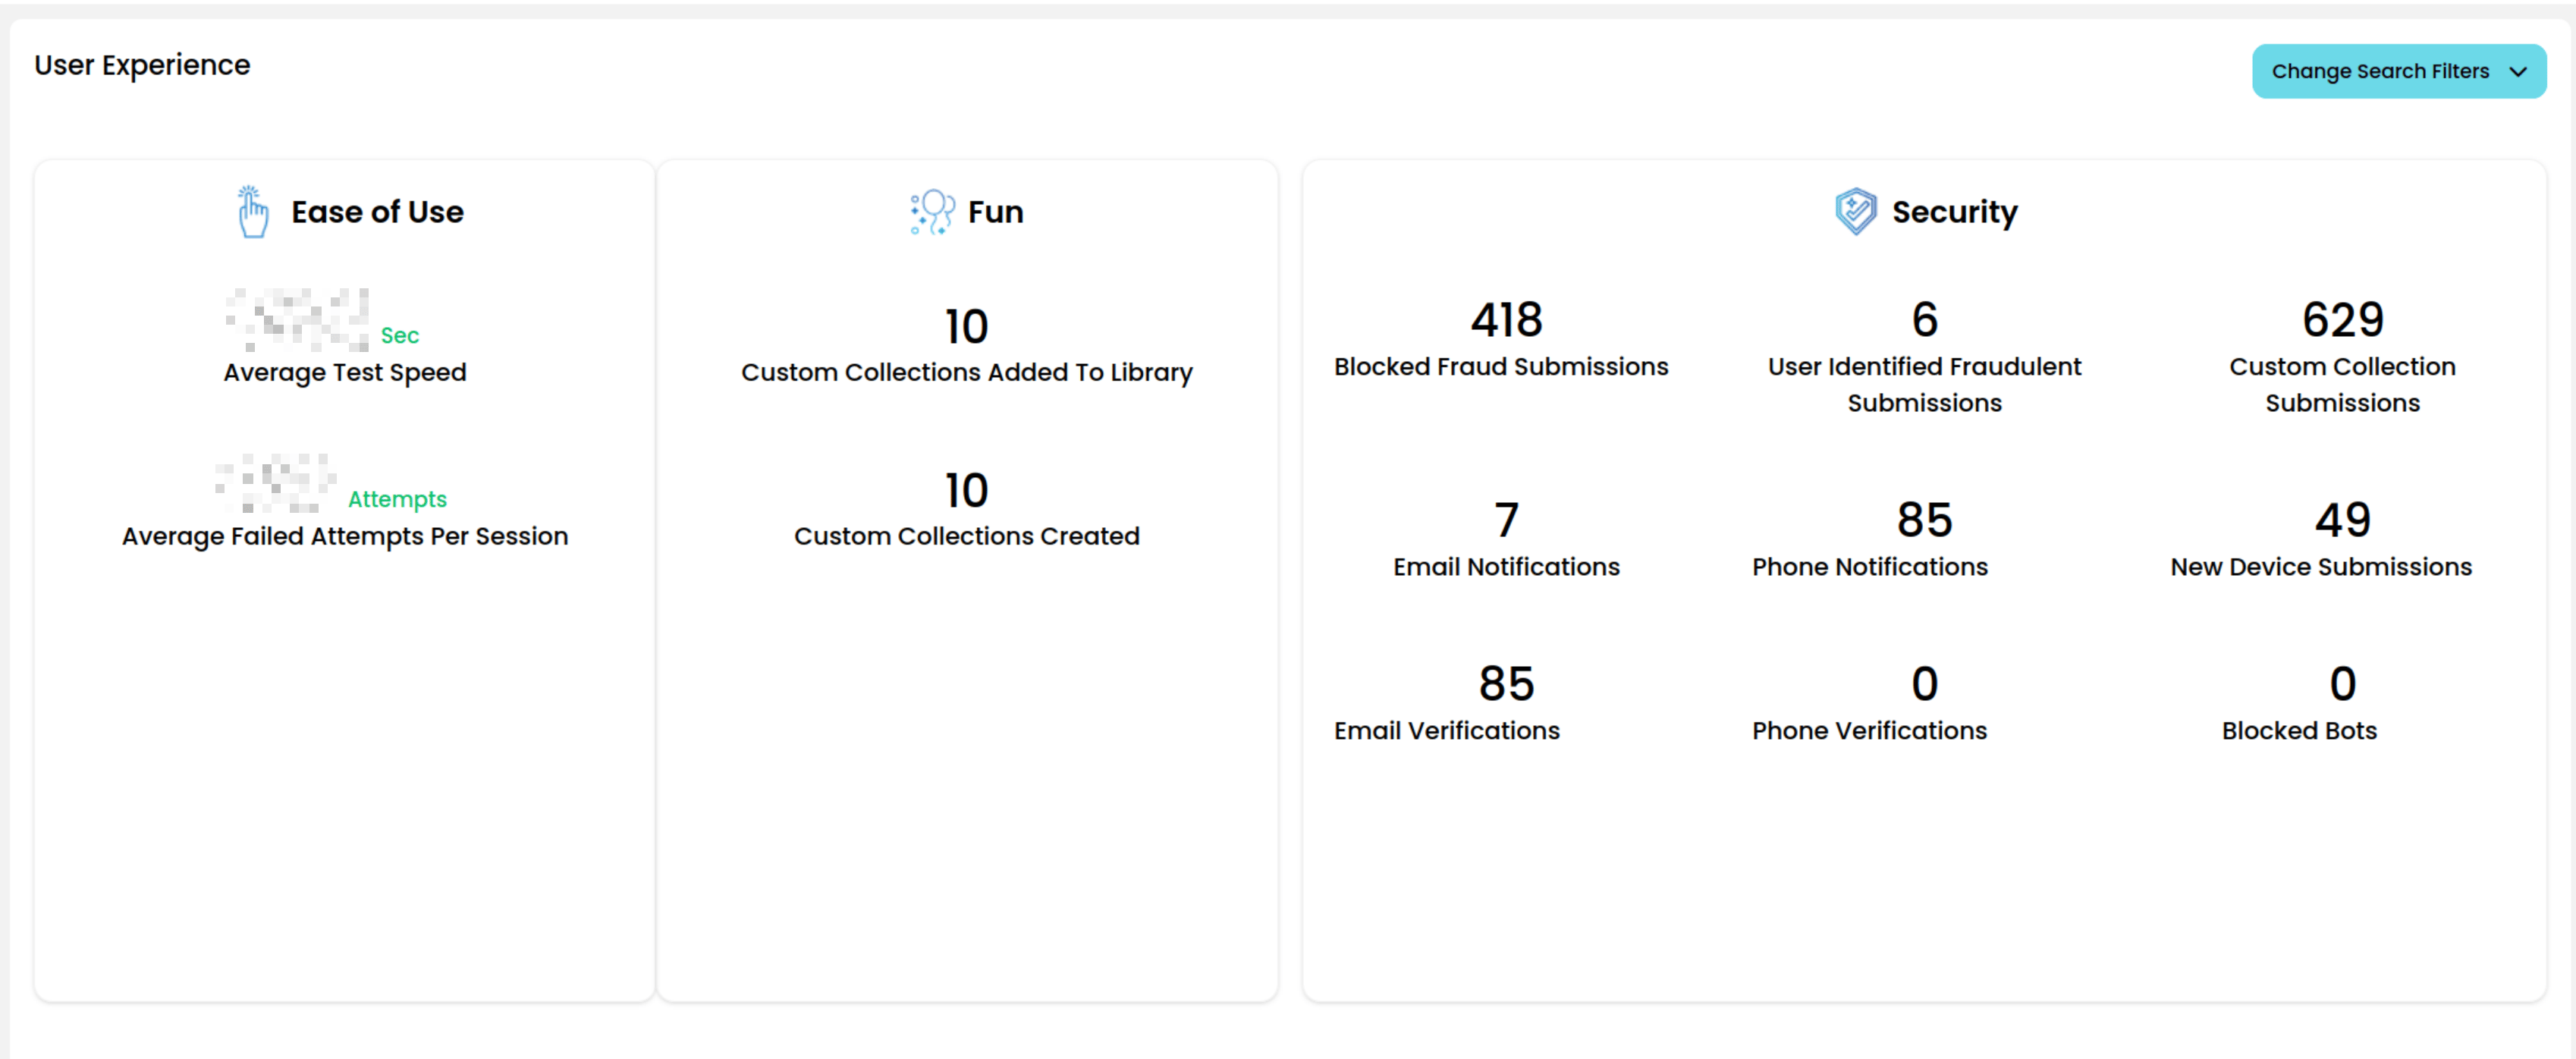
Ease of Use Statistics
To better understand how easy the Bot Buster Quick Check is to use, see your current average test speed and average number of Quick Check attempts.Fun Statistics
These statistics are about Quick Check collection usage.Security Statistics
See how you have made use of the additional BB security actions.- Blocked Fraudulent Submissions
- User Identified Fraudulent Submissions
- Email Notifications
- Email Verifications
- Phone Notifications
- Phone Verifications
- Submissions with Custom Instructions
- New Device Submissions
- Blocked Bots
Time Charts
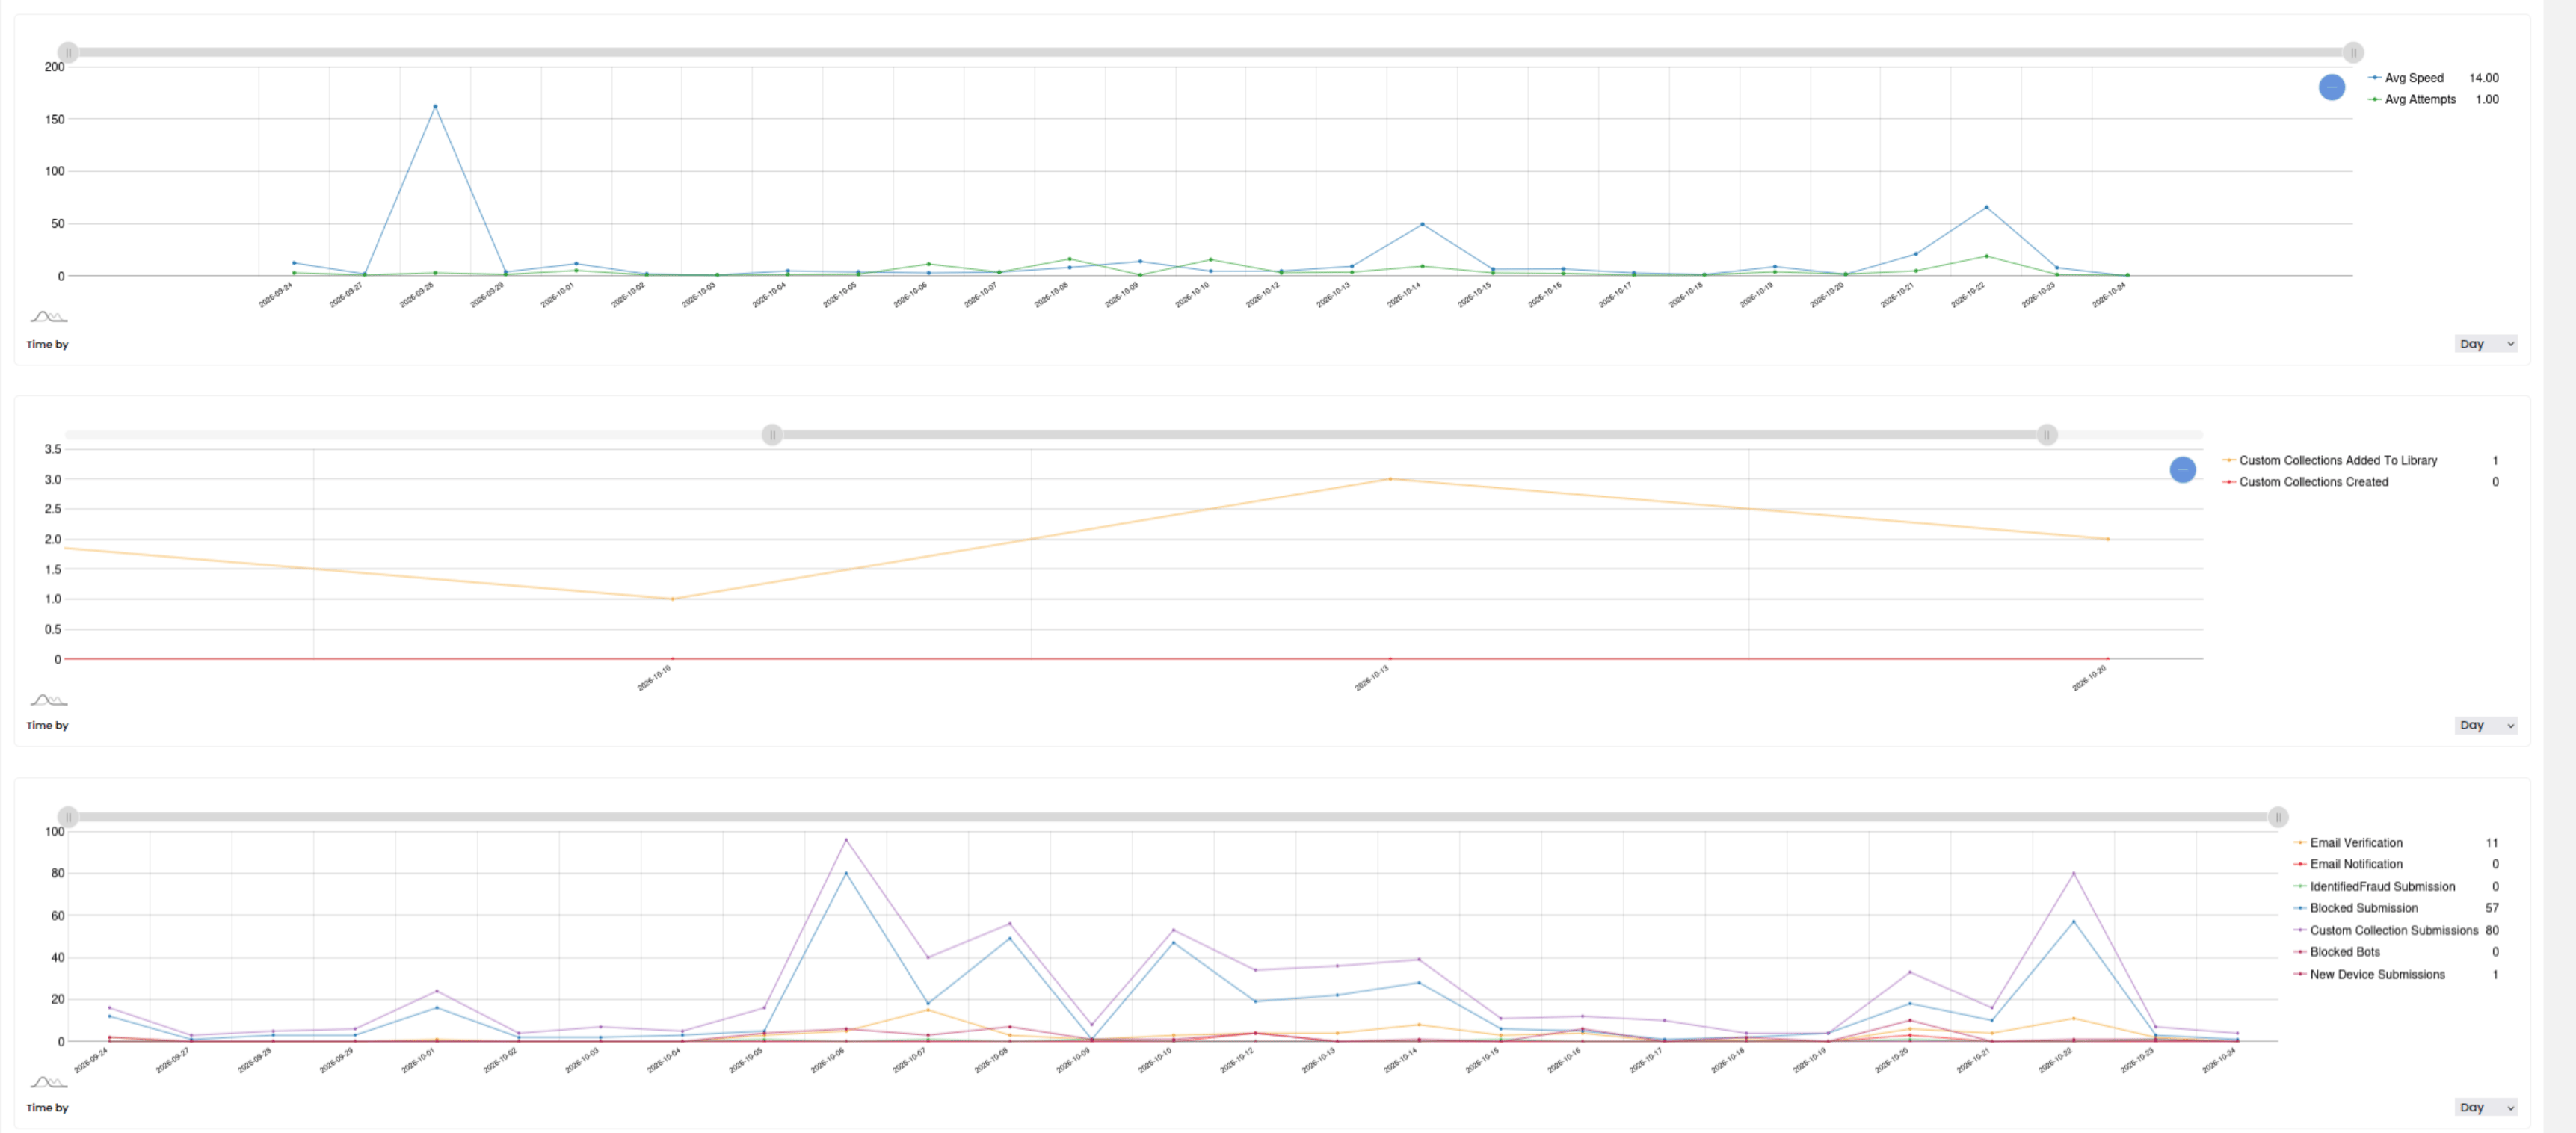
- View Ease of Use statistics in the top chart
- View Fun statistics in the middle chart
- View Security statistics in the bottom chart