Introduction
The summary dashboard gives an overview of submissions with charts, tables, graphs and a map.Dashboard Filters
The data in the dashboard can be filtered by selecting the Change Search Filters dropdown. Here it is possible to filter submission data across the dashboard based on time, country, submission type, IP Address, bot scores, tags, URL Location, if identified as a bot and by the submission status. The search filters and chart selections can be reset to default values with the reset button. To apply the filters selected press the Apply Filters button. When filters are applied, the dashboard may take a moment to recalculate and update all the elements on the page.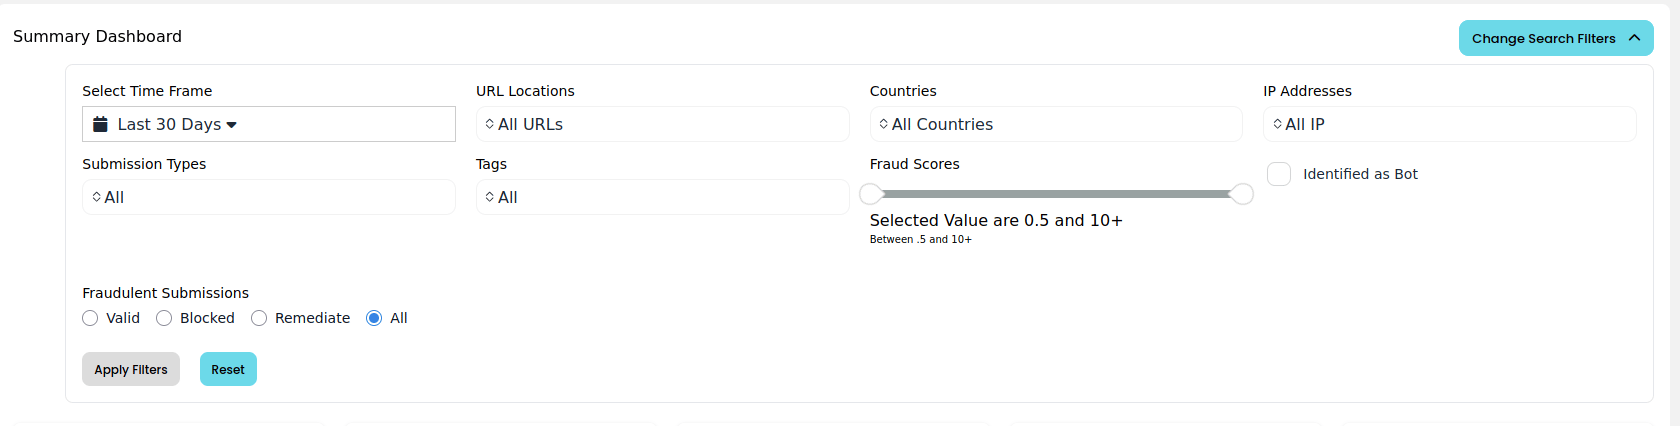
Quick Check Statistics
The top row of this dashboard shows the following statistics:- Total Submissions :: The number of times your customers submitted Quick Check tests. This includes blocked attempts and successful submissions.
- Valid Submissions :: The number of test submissions which were successful.
- Blocked Submissions :: The number of test submissions that were blocked.
- Remediated Fraud :: The number of test submissions which were identified as fraudulent and then remediated.
- Solver Identified Fraud :: The number of test submissions which your customers have identified as fraudulent. Clicking on this statistic transports you to the Fraud Explorer Dashboard where these critical submissions can be investigated, managed and proper communication can take place directly with your users.

Charts
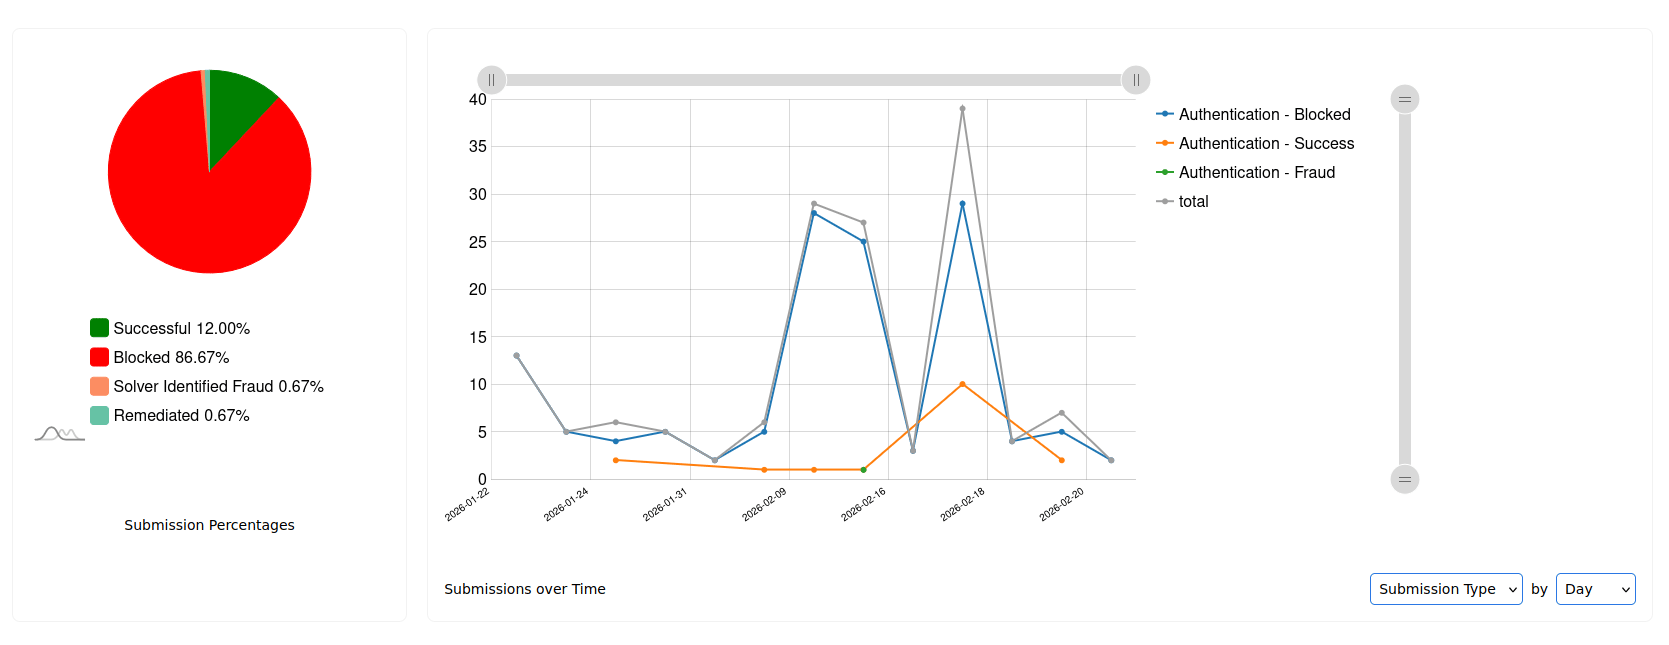
The charts include:- Total Submissions :: This is a pie chart showing the number of different kinds of submissions.
- Submissions Over Time :: This is a line chart showing submissions over time.
The line chart allows its legend items to be clicked to hide or show different chart statistics. The chart data can also be grouped by IP Address, Country, Submission Type as well as by Day, Week or Month.
Tables
The tables include:- Submissions by Country :: This table shows the number of blocked and successful submissions by the country they were submitted from. locations are calculated by IP address
- Submissions by IP :: This table shows the number of blocked and successful submissions by the IP Addresses they were completed from.
- Submissions by Submission Type :: This table shows the number of submissions broken down by type of submission.
- Fraudulent Submissions :: This table shows the number of fraudulent submissions broken down by block reason, bot identification or by human identification.
- Submissions by URL Location :: This table shows the number of submissions broken down by the URL locations where Quick Check tests were submitted from across your entire account.
Every table is sortable by clicking the column. Columns can be added and removed from each table. Every table can be downloaded as a CSV file.
Map
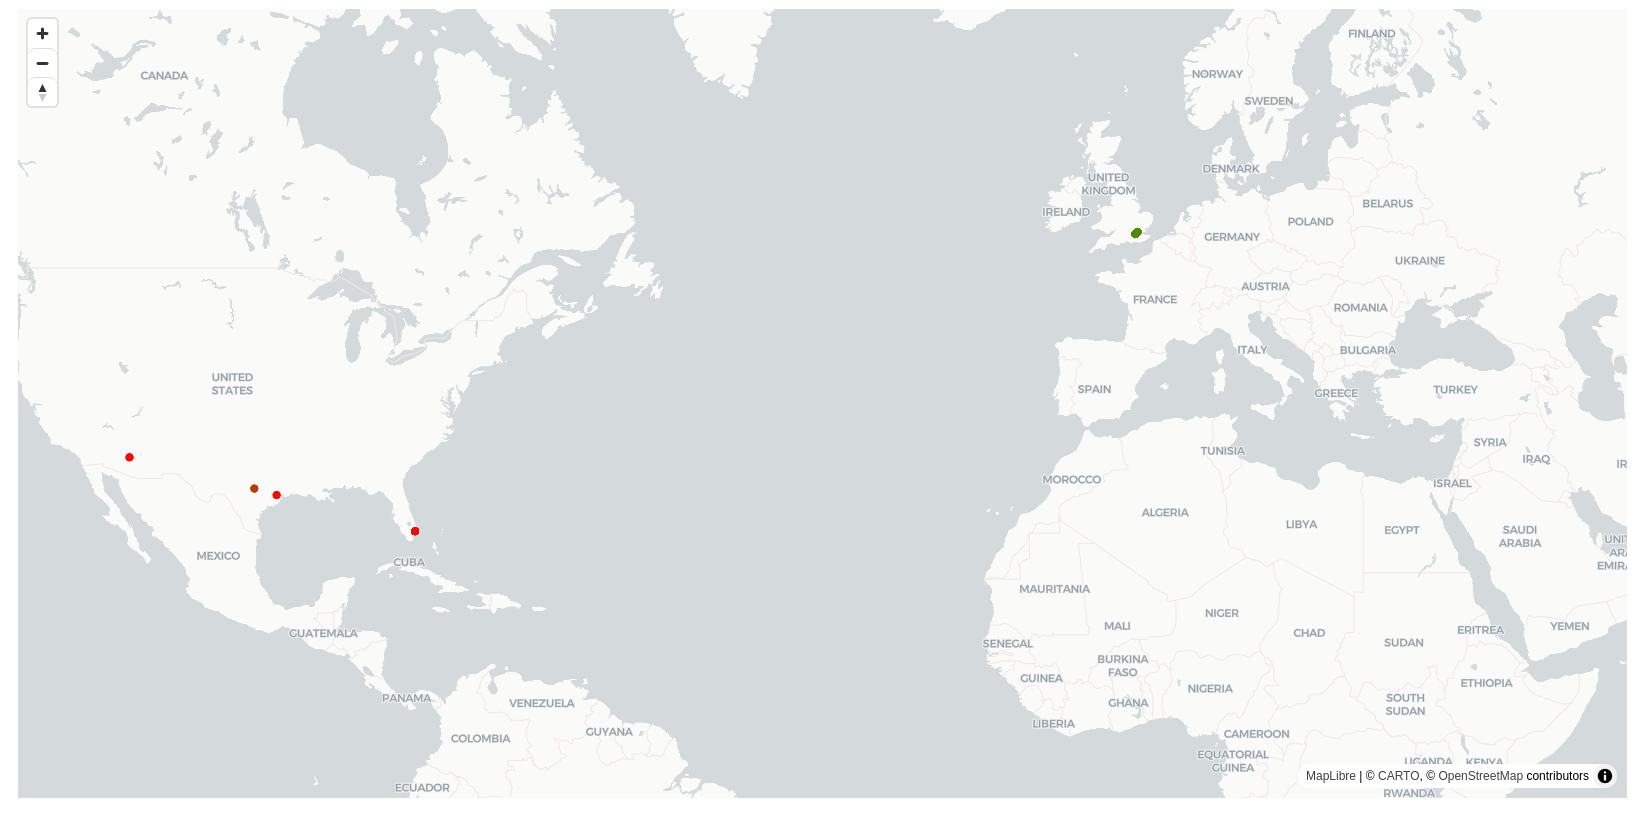
The map shows the successful, blocked, identified fraud and remediated submissions grouped by location. Hover over a dot to see submission statistics for that location. Larger dots have higher numbers of submissions. Clicking the dot will show those submissions in the Fraud Explorer dashboard. Locations are calculated by IP address